Theme

The Tag Explorer webapp and the manual can be viewed in a dark or light theme according to your preference. Click the icon at the top right to change the theme.
Section 01
Loading a CSV file
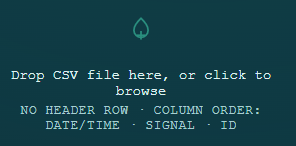
Everything starts with a detection log CSV. The file has no header row; every row is read as three columns in a fixed order: Date Time,Signal,ID. The ID can be any alphanumeric string. Hexadecimal strings are used in the 2026 summer files.
For example:
2026-06-25 20:10:27,158,0F21683D9
2026-06-25 20:15:56,137,0F21683D9
...
Interactions
- Click Click anywhere in the dropzone to open a file picker.
- Drag Drag and drop a file on the dropzone to load it immediately.
Once loaded, the filename appears under the dropzone and the page fills in below it. If a row can't be parsed, a warning banner explains what was skipped rather than silently dropping data.
Section 02
Filter controls
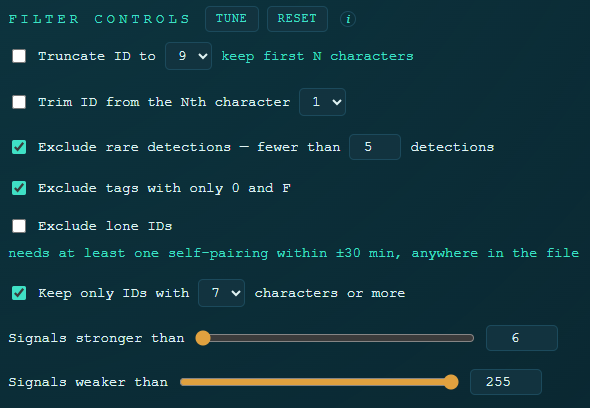
These controls clean up decoded IDs before anything downstream sees them. They stack — several can be active at once — and everything below the fold (charts, stats, the entries table) updates live as you change them.
| Control | What it does |
|---|---|
| Truncate ID to N | Keeps only the first N characters of every decoded ID, discarding the rest. |
| Trim ID from the Nth character | Cuts each ID off starting at position N, keeping everything before it. |
| Exclude rare detections | Drops any ID seen fewer than the given number of times in the whole file. |
| Exclude tags with only 0 and F | Removes IDs made up entirely of the characters 0 and F — a common noise pattern. |
| Exclude lone IDs | Drops any ID that never has two of its own detections within ±30 minutes of each other, anywhere in the file. One such pairing anywhere is enough to keep it — the ID doesn't need to stay paired throughout. |
| Keep only IDs with N+ characters | Drops any ID shorter than N characters — short IDs are usually noise, collisions, or a dying tag battery. |
| Signals stronger / weaker than | Two linked slider + number pairs that restrict the signal-strength range considered. |
Interactions
- Click Tune applies a recommended preset in one click: exclude IDs seen fewer than 5 times, exclude 0/F-only tags, and keep only IDs with 7+ characters. It does not enable Exclude lone IDs — that one's a stronger cut and stays opt-in.
- Click Reset clears every filter above back to its default (off) state and resets the signal range to the full span of the loaded file.
- Drag Drag either signal-range slider, or type directly into its number box — both stay in sync.
Section 03
Notes panel
A short panel next to the filters gives background on the project (this is a hobby monitoring setup, not a scientific study) and a live count of total recording hours for the loaded file. Below a divider, it repeats the same methodology notes covered section-by-section in this manual, for quick reference without leaving the page.
A one-line reminder here also recommends refreshing with Ctrl+Shift+refresh so your browser doesn't serve a stale cached copy of the tool after an update — see Tips & troubleshooting.
Section 04
Detections by ID (sidebar)
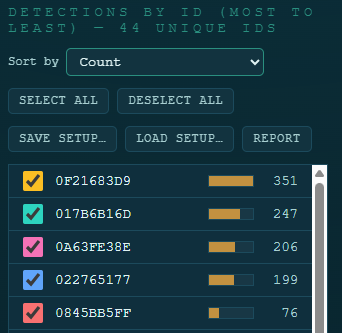
This sidebar is the control center for every chart on the page: every ID that survives the filters above gets one row, with a checkbox, a bar showing its value under the current sort mode, and a count or percentage. Unchecking an ID removes it from every downstream chart (the ones counted by detection) instantly. The heading above the list shows how many unique IDs are currently listed and, in parentheses, how many of those are checked.
Interactions
- Click Toggle a row's checkbox to include/exclude that ID everywhere.
- Click Select all / Deselect all to bulk-toggle every currently listed ID.
- Click Change the Sort by dropdown to re-rank and re-color the list by a different metric (see Methodology below).
- Click Save State… / Load State… / Report — see Saving, loading & the Report.
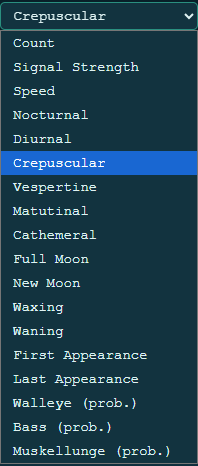
Methodology — sort modes
Count and Signal Strength and Speed are the raw detection count, the strongest signal reading, and the fastest observed signal change for each ID, respectively.
Nocturnal and Diurnal split detections at true sunrise/sunset for the monitoring site's coordinates (computed with the standard NOAA solar-position equations), so the two percentages are complementary and sum to 100%.
Matutinal, Vespertine, and Crepuscular instead use a 90-minute twilight window centred on sunrise and sunset (45 minutes either side): Matutinal ranks by the dawn-window share, Vespertine by the dusk-window share, and Crepuscular by the two combined.
Cathemeral scores how evenly an ID's detections spread across the 24 hours of the day, using normalised Shannon entropy of its hourly histogram. 100% is perfectly even; 0% means every detection landed in a single hour.
Full Moon / New Moon split on lunar illumination (more vs. less than half-lit) and sum to 100%; Waxing / Waning split on which half of the lunar cycle the detection fell in and are likewise complementary. See Detections by Moon Phase for the underlying phase calculation.
First Appearance ranks IDs by their earliest detection, oldest first — like an arrival log. Last Appearance ranks by most recent detection, newest first — "who's been around most recently." Both are the only two sort modes that don't rank by a 0–100% value: the sidebar shows a compact MM-DD date instead, and the bar length is scaled between the earliest and latest date actually present in the list, not from zero (raw timestamps are all huge, close-together numbers, so scaling from zero would make every bar look nearly full).
Walleye / Bass / Muskellunge (prob.) are a heuristic behavioural classifier, not a measured identification — each ID's timing signature is scored against a hand-tuned profile of that species' known chronobiology, and the three scores are normalised to sum to 100%:
- Walleye — photophobic; rewards a high Nocturnal share plus concentrated (low-Cathemeral) activity.
- Bass — diurnal sight-feeder; rewards a high Diurnal share plus evenly spread (high-Cathemeral) activity.
- Muskellunge — crepuscular ambush predator; rewards a high Crepuscular share plus fast burst movement (high Max Speed).
Treat species probabilities as a prior, not evidence — the weights reflect published behaviour, not a fit to this data. See Methods & References for the sources behind each species profile.
A further Smallmouth / Largemouth split exists but isn't in this dropdown either — like Buddies, it's not a sort mode. It only appears in the Single-ID detail panel, and only when Bass is already that ID's top species guess. See that section for the reasoning.
One more sort mode, Buddies, exists but isn't in this dropdown — it only appears once triggered from the Single-ID detail panel's "Find my buddies" button.
Section 05
Summary stats

Six read-only tiles above the main plot: Detections, Unique IDs, First Date/Time, Last Date/Time, Max Signal, and Min Signal. Each shows the currently-filtered value alongside the file's unfiltered total (e.g. "412 of 1,890"), so you can see at a glance how aggressive your current filters are. An ID is a decoded sequence of gap times between 69 KHz signal detections.
Section 06
Signal Strength Over Time
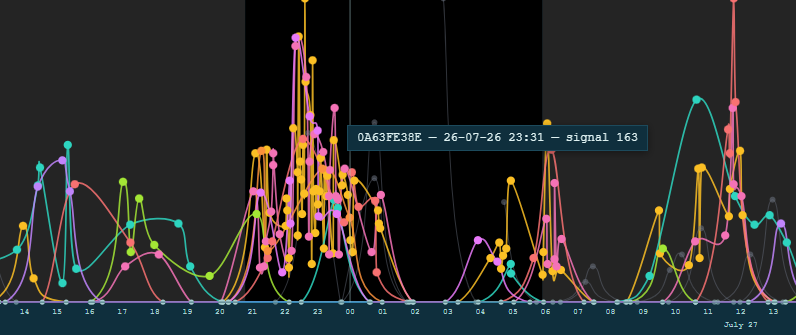
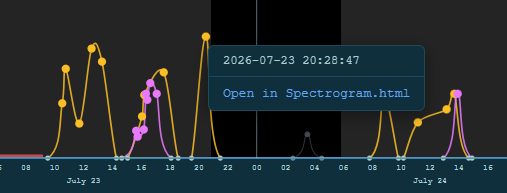
This is the main chart: signal strength over time, one line per checked ID, with the top 10 (by whatever the sidebar is currently sorted by) drawn in bold color and everything else in muted grey. Black/dark-grey background stripes mark night vs. day for the site's real sunrise and sunset. The thick red line near the bottom axis marks gaps in the recording with no data available. Small moon icons sit in a strip near the top — see the Methodology box below.
Interactions
- Hover Hover near any point to see a tooltip with the ID, timestamp, and signal value. Hover a moon icon for its phase name and exact date/time.
- Click Click near a data point to isolate that one ID everywhere (a short delay distinguishes this from the start of a drag).
- Drag Click-and-drag (mouse) or one-finger drag (touch) to pan left/right in time.
- Scroll / Pinch Mouse wheel, or a two-finger pinch on touch, to zoom in/out, centred on the cursor or the pinch midpoint.
- Double-click / double-tap Reset the zoom and pan back to the full data range.
- Right-click Opens a small context menu showing the exact time (to the second) under the cursor, with a time field you can click to copy and a link that opens the recorded audio in Spectrogram.html

Methodology
Day/night shading uses the standard NOAA solar-position equations (Julian day → solar mean anomaly → ecliptic longitude → declination → hour angle) for the site's coordinates, with the horizon taken at −0.833° to allow for atmospheric refraction and the sun's radius. It's recalculated per calendar date, so seasonal day-length changes are reflected.
Moon-phase icons — a dark circle (New Moon), right-half-lit (First Quarter), fully lit (Full Moon), and left-half-lit (Last Quarter) — mark the exact moment each phase occurs, computed from a standard synodic-month approximation (29.530589 days) anchored to a known reference new moon. This doesn't need the site's coordinates, since lunar phase (unlike sunrise/sunset) doesn't depend on location. Only phases falling inside whatever range is currently zoomed/panned are drawn, and they redraw as you navigate.
Offline periods come from offline.csv, a separately-computed log of recording gaps derived from AudioMoth filenames.
Section 07
Single-ID detail panel
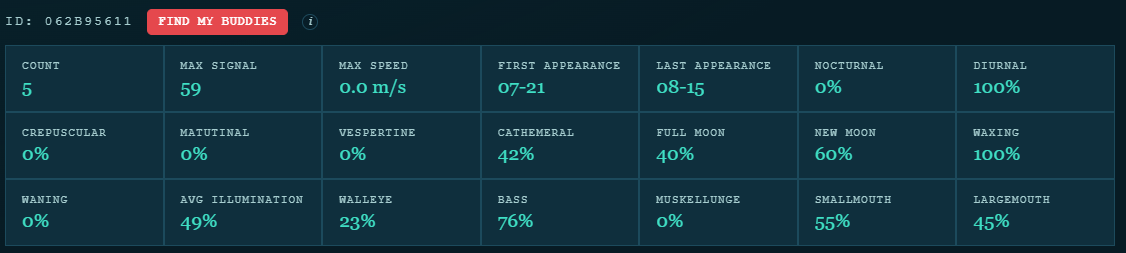
This panel appears automatically whenever exactly one ID is checked in the sidebar, and disappears again as soon as zero or more than one are checked. It's a read-only grid showing every metric the sort dropdown can rank by, all at once, for that single ID: Count, Max Signal, Max Speed, all six day/night timing percentages, all four lunar percentages, Avg Illumination, and all three species probabilities. When Bass comes out as the top species guess for this ID, two extra rows appear — Smallmouth and Largemouth — breaking that Bass guess down further.
Interactions
- Click Find my buddies, next to the ID heading, re-checks every ID in the sidebar and switches it to a Buddies ranking for the ID this panel is showing — see Methodology below.
Methodology — Find my buddies
For every detection of the selected ID, each other ID gets credit if it has at least one detection of its own within ±30 minutes of that timestamp — at most one credit per target detection, no matter how many nearby detections that other ID actually has. The score is that count divided by the selected ID's total detection count, so 100% means "detected within 30 minutes of every single one of this fish's detections," and the target ID itself always shows 100%. IDs with no co-occurrences at all are left off the list rather than shown at 0%.
This puts the sidebar into a Buddies sort mode that isn't in the regular Sort by dropdown — it only exists once "Find my buddies" has been clicked, is scoped to whichever ID it was clicked from, and reverts to a normal sort the next time a different sort mode is chosen.
Methodology — Smallmouth vs. largemouth
This is a sub-split of the Bass guess, not a fourth peer species, so it only shows up once Bass is already the highest of the three species scores for this ID — otherwise the breakdown wouldn't mean anything. Smallmouth bass tend to be more active, roaming chase-feeders that stay busy through daylight, so that score rewards a high Diurnal share and a high Max Speed. Largemouth bass are slower, more sedentary ambush predators that lean nocturnal, especially in warm water, so that score rewards a high Nocturnal share and a low Max Speed. Diurnal/Nocturnal are already complementary, and so is speed vs. "not fast," so with matching weights on both sides the two percentages always sum to exactly 100%. Source: Methods & References.
Section 08
Detections by Date
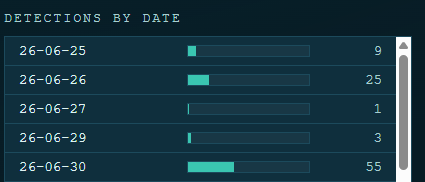
Pick a single day to display. A bar sized relative to the busiest day is shown.
Interactions
- Click Click a date row to isolate every ID detected that day, and jump the main timeline to zoom into that full 24-hour window (the page auto-scrolls up to the timeline).
Section 09
Detections by Hour of Day
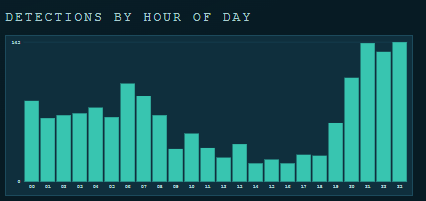
A 24-bar histogram, one bar per hour (00–23), counting detections across every checked ID.
Interactions
- Hover Hover a bar for the exact hour and detection count.
- Click Click a bar to isolate every ID detected during that hour, across the whole dataset.
Section 10
Detections by Temperature
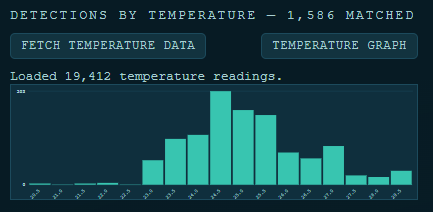
A histogram of detections binned by water temperature, only shown once temperature data has been fetched.
Interactions
- Click Fetch Temperature Data loads readings for the site (from
temp.csv) and reveals this chart. - Click Temperature Graph opens the site's standalone water-temperature chart in a new tab.
- Hover Hover a bar for the exact temperature bin and count.
- Click Click a bar to isolate the IDs detected in that temperature bin.
Methodology
Each detection is matched to the nearest-timestamp temperature reading, restricted to dates that have at least one detection, then binned to the nearest 0.5° (i.e. ±0.25°).
Section 11
Detections by Moon Phase
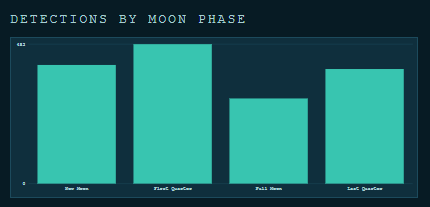
A 4-bar histogram — New Moon, First Quarter, Full Moon, Last Quarter — counting detections that fell in each quarter of the lunar cycle.
Interactions
- Hover Hover a bar for the phase name and detection count.
- Click Click a bar to isolate the IDs detected during that phase.
Methodology
Lunar phase is computed from a standard synodic-month approximation (29.530589 days) anchored to a known reference new moon — no site coordinates are needed, since the phase itself doesn't depend on location. The cycle is split into four equal quarters, each centred on its named phase: New Moon spans the 12.5% of the cycle around phase 0, and so on for First Quarter (~25%), Full Moon (~50%), and Last Quarter (~75%).
This is the same phase model behind the Full Moon / New Moon / Waxing / Waning sort modes in the sidebar and the moon icons on the main timeline, so all three stay consistent with each other. It's a linear approximation, not full orbital mechanics, so exact phase moments can be off by roughly an hour up to about half a day depending on the time of year — closest for full moons.
Section 12
IDs by Residency (Days)
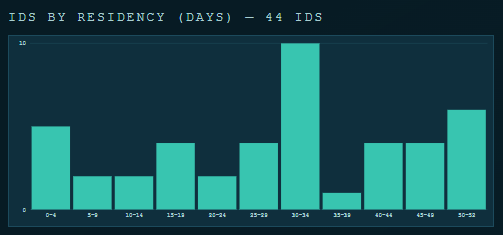
Unlike the other histograms, this one counts IDs, not detections. For every checked ID, residency is the span between its first and last detection, rounded to the nearest whole day — an ID seen only once (or several times the same day) has 0 days of residency. Bars are grouped in 5-day bins (0–4, 5–9, 10–14, …), labelled with the day range each bar covers, so the shape of the distribution stays readable even over long deployments.
Interactions
- Hover Hover a bar for its day range and how many IDs fall in it.
- Click Click a bar to isolate every ID whose residency falls in that 5-day range.
Section 13
Detections by Date & Hour
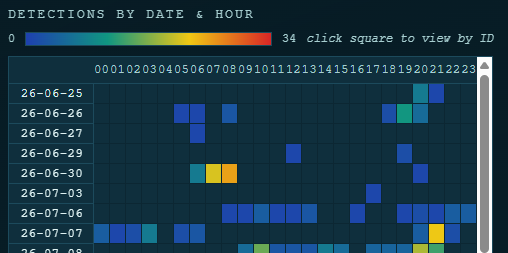
A grid with one row per date and one column per hour (00–23); cell shade encodes detection count, from the legend's min to max.
Interactions
- Hover Hover a square for the date, hour, and count.
- Click Click a square to isolate the IDs detected in that date/hour cell, and zoom the main timeline to a 5-hour window centred on it (the page auto-scrolls to the timeline).
Section 14
Detections by ID & Hour
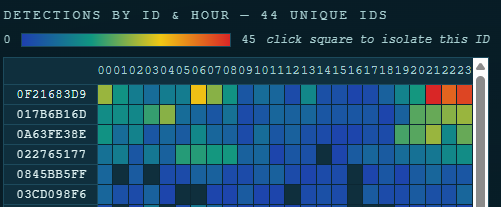
Same idea as the previous heatmap, but rows are IDs (most-detected first) instead of dates, and columns are still hours 00–23.
Interactions
- Hover Hover a square for the ID, hour, and count.
- Click Click a square to isolate that single ID.
Section 15
Detections by Speed & Hour
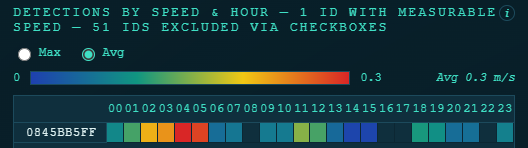
Rows are IDs, columns are hours; instead of a count, each cell's shade shows either the fastest or the average movement observed for that ID around that hour, depending on the Max / Avg choice above the legend.
Interactions
- Click Max / Avg radio buttons switch how every cell is calculated — see Methodology below. Max is selected by default.
- Hover Hover a square for the ID, hour, and speed — Avg cells also show how many samples went into that average.
- Click Click a square to isolate that ID. In Max mode this also zooms the timeline to a 5-hour window centred on the exact moment that peak speed was recorded; Avg mode isolates the ID without changing the zoom, since an average has no single moment to jump to.
Methodology
Speed is |change in signal| divided by the minutes between two successive detections of the same ID, reported in m/s after dividing the raw value by 100. Pairs more than 30 minutes apart, or with a zero reading at either end, are ignored — this rule is shared by both modes.
Max attributes each pair to the hour its first detection falls in, and a cell shows the largest speed among pairs starting in that hour.
Avg instead uses a sliding 2-hour window centred on each hour column — 30 minutes before it starts through 30 minutes after it ends — and averages every pair whose first detection falls in that window. Because neighbouring hours' windows overlap by an hour on each side, the same pair can contribute to two adjacent columns; this is intentional smoothing, not double-counting a single "true" value. Two points (one pair) is already enough to fill a cell — there's no larger minimum sample size.
Section 16
Same-Hour Co-Detection Matrix
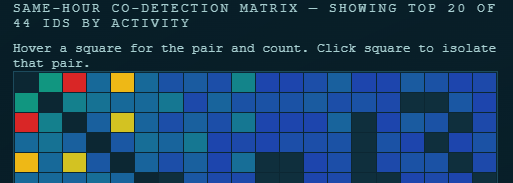
A square ID × ID grid where a cell's shade shows how often that pair of IDs was detected within the same hour — useful for spotting fish that tend to travel or feed together.
Interactions
- Hover Hover a square for the pair of IDs and their shared-hour count.
- Click Click a square to isolate exactly that pair of IDs.
Section 17
Entries table
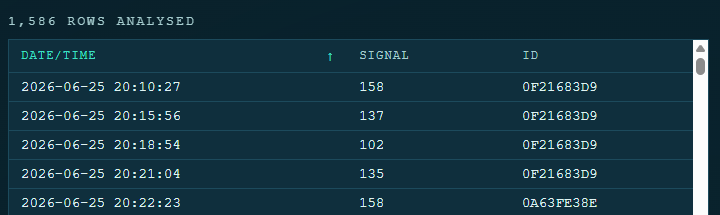
The full row-by-row table at the bottom of the page: Date/Time, Signal, ID — the same rows currently plotted on the Signal Strength Over Time chart, meaning both the filter panel and the sidebar checkboxes are already applied. One row per matching line of the source CSV.
Interactions
- Click Click a column header (Date/Time, Signal, or ID) to sort by that column; click the same header again to reverse the sort direction. An arrow shows the current column and direction.
- Click Click any Date/Time cell to copy its exact value to the clipboard — the cell briefly highlights to confirm.
- Click Save CSV… downloads exactly the rows currently in the table — same filters, same checked IDs, same sort order — as a CSV in the same no-header,
Date/Time,Signal,IDshape this tool loads. Handy for saving a cleaned-up or narrowed-down subset of a file back out.
Section 18
Undo, shortcuts & theme
Almost every "isolate" click described above (chart bars, heatmap cells, date rows, checkboxes, sort-mode changes) is undoable — the tool remembers a short history of ID-selection snapshots.
Interactions
- Ctrl+Z (or Cmd+Z on Mac) steps back through the selection history. A small toast in the bottom of the screen names what's being undone, and fades out on its own. This is ignored while you're typing in a text field, number field, or dropdown, so it won't fight with normal text editing.
- Click The circular button in the top-right corner toggles between the dark theme (default) and a light theme.
Section 19
Saving, loading & the Report
Three buttons in the sidebar (see Detections by ID) let you carry a selection of IDs between sessions or hand off a summary to someone else.
Interactions
- Click Save State… prompts for a filename and downloads a JSON file capturing every filter control's current value, the sort mode, and the list of currently-checked IDs.
- Click Load State… opens a file picker for a previously saved JSON file, restores every filter and the sort mode to the values it was saved with, then checks exactly the IDs it listed (unchecking everything else). Older files saved before this existed — with just an ID list and no filters — still load fine; only the checked IDs are restored in that case.
- Click Report opens a new browser tab with a clean, printable table of every checked ID and its full set of metrics (Count, Max Signal, Max Speed, all timing and lunar percentages), plus a methodology footnote. A Save as PDF / Print button sits at the top of that tab.
Section 20
Tips & troubleshooting
- Seeing an old version? This tool is updated often and browsers aggressively cache it. Refresh with Ctrl+Shift+R (or hold Shift while clicking the reload button) to force a fresh copy.
- Nothing shows up after loading a file. Check the filter panel — an aggressive combination of filters (especially Keep only IDs with N+ characters, Exclude rare detections, and Exclude lone IDs) can filter out an entire small dataset. Click Reset to confirm.
- The right-click menu or a tooltip won't go away. Click anywhere else on the page, scroll, or zoom the timeline — all three dismiss it.
- Short IDs. Innovasea tags nominally transmit 8–10 pulses (7–9 timed gaps that encode the ID). Shorter decoded IDs usually mean noise, signal collisions, or a tag nearing end-of-battery-life. Some tags also transmit sensor data, which this tool will interpret as a distinct "ID."